Annotating cell clusters by integrating single-cell RNA-seq data#
Introduction#
In this tutorial we will integrate single-cell RNA-seq data to annotate the cells in our ATAC-seq data. Before we begin, you should have read the Standard Pipeline tutorial and known how to obtain the gene activity matrix.
In addition to SnapATAC2, we will utilize scanpy and scvi-tools to perform the integration.
[1]:
import snapatac2 as snap
import scanpy as sc
import scvi
import numpy as np

snap.__version__
2023-04-09 12:09:23 - INFO - Created a temporary directory at /tmp/tmpz90s12od
2023-04-09 12:09:23 - INFO - Writing /tmp/tmpz90s12od/_remote_module_non_scriptable.py
2023-04-09 12:09:23 - INFO - Global seed set to 0
/projects/ps-renlab2/kai/software/micromamba/lib/python3.9/site-packages/pytorch_lightning/utilities/warnings.py:53: LightningDeprecationWarning: pytorch_lightning.utilities.warnings.rank_zero_deprecation has been deprecated in v1.6 and will be removed in v1.8. Use the equivalent function from the pytorch_lightning.utilities.rank_zero module instead.
  new_rank_zero_deprecation(
/projects/ps-renlab2/kai/software/micromamba/lib/python3.9/site-packages/pytorch_lightning/utilities/warnings.py:58: LightningDeprecationWarning: The `pytorch_lightning.loggers.base.rank_zero_experiment` is deprecated in v1.7 and will be removed in v1.9. Please use `pytorch_lightning.loggers.logger.rank_zero_experiment` instead.
  return new_rank_zero_deprecation(*args, **kwargs)
[1]:
'2.3.0.dev3'
Preparing data#
Let’s first analyze the single-cell RNA-seq data from PBMCs. We will closely follow the scanpy tutorials here. For more details, please read the scanpy documentation.
We first import the reference single-cell RNA-seq data in which the cells have been annotated.
[2]:
reference = sc.read(snap.datasets.pbmc10k_multiome())
reference
[2]:
AnnData object with n_obs × n_vars = 9631 × 29095
    obs: 'domain', 'cell_type'
    var: 'gene_ids', 'feature_types'
We then import the gene activity matrix of single-cell ATAC-seq data. If you don’t know how to get the gene activity matrix, please read the Standard Pipeline tutorial.
[3]:
query = sc.read(snap.datasets.pbmc5k(type='gene'))
query
[3]:
AnnData object with n_obs × n_vars = 4436 × 54432
    obs: 'tsse', 'n_fragment', 'frac_dup', 'frac_mito', 'doublet_probability', 'doublet_score', 'leiden'
    var: 'n_cells'
    uns: 'leiden_colors', 'log1p'
    obsm: 'X_umap'
Finally, we merge reference data and query data together and use the scanpy library to find out highly variable genes. After this, we are ready to utilize scvi-tools to perform the integration.
[4]:
data = reference.concatenate(query, batch_categories=["reference", "query"])
data
/projects/ps-renlab2/kai/software/micromamba/lib/python3.9/site-packages/anndata/_core/anndata.py:1785: FutureWarning: X.dtype being converted to np.float32 from float64. In the next version of anndata (0.9) conversion will not be automatic. Pass dtype explicitly to avoid this warning. Pass `AnnData(X, dtype=X.dtype, ...)` to get the future behavour.
  [AnnData(sparse.csr_matrix(a.shape), obs=a.obs) for a in all_adatas],
[4]:
AnnData object with n_obs × n_vars = 14067 × 20035
    obs: 'domain', 'cell_type', 'tsse', 'n_fragment', 'frac_dup', 'frac_mito', 'doublet_probability', 'doublet_score', 'leiden', 'batch'
    var: 'n_cells-query', 'gene_ids-reference', 'feature_types-reference'
[5]:
data.layers["counts"] = data.X.copy()
sc.pp.filter_genes(data, min_cells=5)
sc.pp.normalize_total(data, target_sum=1e4)
sc.pp.log1p(data)
sc.pp.highly_variable_genes(
    data,
    n_top_genes = 5000,
    flavor="seurat_v3",
    layer="counts",
    batch_key="batch",
    subset=True
)
/projects/ps-renlab2/kai/software/micromamba/lib/python3.9/site-packages/scanpy/preprocessing/_highly_variable_genes.py:62: UserWarning: `flavor='seurat_v3'` expects raw count data, but non-integers were found.
  warnings.warn(
Data integration#
First we setup the scvi-tools to pretrain the model.
[6]:
scvi.model.SCVI.setup_anndata(data, layer="counts", batch_key="batch")
vae = scvi.model.SCVI(
    data,
    n_layers=2,
    n_latent=30,
    gene_likelihood="nb",
    dispersion="gene-batch",
)
2023-04-09 12:09:38 - INFO - Remote TPU is not linked into jax; skipping remote TPU.
2023-04-09 12:09:38 - INFO - Unable to initialize backend 'tpu_driver': Could not initialize backend 'tpu_driver'
2023-04-09 12:09:38 - INFO - Unable to initialize backend 'cuda': module 'jaxlib.xla_extension' has no attribute 'GpuAllocatorConfig'
2023-04-09 12:09:38 - INFO - Unable to initialize backend 'rocm': module 'jaxlib.xla_extension' has no attribute 'GpuAllocatorConfig'
2023-04-09 12:09:38 - INFO - Unable to initialize backend 'tpu': module 'jaxlib.xla_extension' has no attribute 'get_tpu_client'
2023-04-09 12:09:38 - INFO - Unable to initialize backend 'plugin': xla_extension has no attributes named get_plugin_device_client. Compile TensorFlow with //tensorflow/compiler/xla/python:enable_plugin_device set to true (defaults to false) to enable this.
2023-04-09 12:09:38 - WARNING - No GPU/TPU found, falling back to CPU. (Set TF_CPP_MIN_LOG_LEVEL=0 and rerun for more info.)
/projects/ps-renlab2/kai/software/micromamba/lib/python3.9/site-packages/scvi/data/fields/_layer_field.py:91: UserWarning: adata.layers[counts] does not contain unnormalized count data. Are you sure this is what you want?
  warnings.warn(
[7]:
vae.train(max_epochs=1000, early_stopping=True)
2023-04-09 12:09:39 - INFO - GPU available: True (cuda), used: True
2023-04-09 12:09:39 - INFO - TPU available: False, using: 0 TPU cores
2023-04-09 12:09:39 - INFO - IPU available: False, using: 0 IPUs
2023-04-09 12:09:39 - INFO - HPU available: False, using: 0 HPUs
2023-04-09 12:09:40 - INFO - LOCAL_RANK: 0 - CUDA_VISIBLE_DEVICES: [0,1,2,3,4,5,6,7]
Epoch 418/1000:  42%|██████████████████████████████████████████████████▌                                                                      | 418/1000 [07:52<10:57,  1.13s/it, loss=2e+03, v_num=1]
Monitored metric elbo_validation did not improve in the last 45 records. Best score: 2052.276. Signaling Trainer to stop.
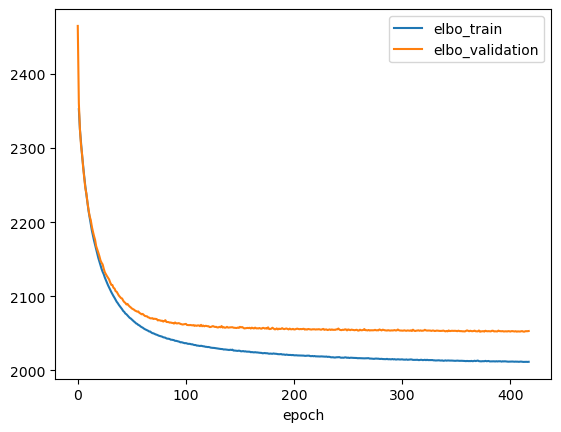
Let’s plot the training history and make sure the model has converged.
[8]:
ax = vae.history['elbo_train'][1:].plot()
vae.history['elbo_validation'].plot(ax=ax)
[8]:
<AxesSubplot: xlabel='epoch'>

[9]:
data.obs["celltype_scanvi"] = 'Unknown'
ref_idx = data.obs['batch'] == "reference"
data.obs["celltype_scanvi"][ref_idx] = data.obs['cell_type'][ref_idx]
/tmp/ipykernel_21681/134013430.py:3: SettingWithCopyWarning:
A value is trying to be set on a copy of a slice from a DataFrame

See the caveats in the documentation: https://pandas.pydata.org/pandas-docs/stable/user_guide/indexing.html#returning-a-view-versus-a-copy
  data.obs["celltype_scanvi"][ref_idx] = data.obs['cell_type'][ref_idx]
[10]:
lvae = scvi.model.SCANVI.from_scvi_model(
    vae,
    adata=data,
    labels_key="celltype_scanvi",
    unlabeled_category="Unknown",
)
/projects/ps-renlab2/kai/software/micromamba/lib/python3.9/site-packages/scvi/data/fields/_layer_field.py:91: UserWarning: adata.layers[counts] does not contain unnormalized count data. Are you sure this is what you want?
  warnings.warn(
[11]:
lvae.train(max_epochs=1000, n_samples_per_label=100)
INFO Training for 1000 epochs.
2023-04-09 12:17:33 - INFO - GPU available: True (cuda), used: True
2023-04-09 12:17:33 - INFO - TPU available: False, using: 0 TPU cores
2023-04-09 12:17:33 - INFO - IPU available: False, using: 0 IPUs
2023-04-09 12:17:33 - INFO - HPU available: False, using: 0 HPUs
2023-04-09 12:17:33 - INFO - LOCAL_RANK: 0 - CUDA_VISIBLE_DEVICES: [0,1,2,3,4,5,6,7]
Epoch 1000/1000: 100%|█████████████████████████████████████████████████████████████████████████████████████████████████████████████████████| 1000/1000 [39:40<00:00, 2.33s/it, loss=2.1e+03, v_num=1]
2023-04-09 12:57:14 - INFO - `Trainer.fit` stopped: `max_epochs=1000` reached.
Epoch 1000/1000: 100%|█████████████████████████████████████████████████████████████████████████████████████████████████████████████████████| 1000/1000 [39:40<00:00, 2.38s/it, loss=2.1e+03, v_num=1]
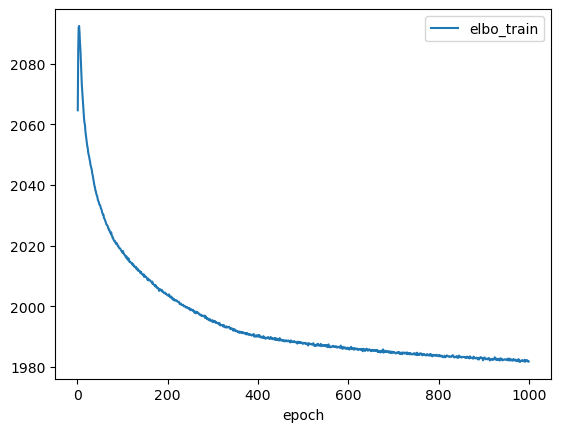
[12]:
lvae.history['elbo_train'][1:].plot()
[12]:
<AxesSubplot: xlabel='epoch'>

We now can perform the label transfer/prediction and obtain the joint embedding of reference and query data.
[13]:
data.obs["C_scANVI"] = lvae.predict(data)
data.obsm["X_scANVI"] = lvae.get_latent_representation(data)
[14]:
sc.pp.neighbors(data, use_rep="X_scANVI")
sc.tl.umap(data)
[15]:
sc.pl.umap(data, color=['C_scANVI', "batch"], wspace=0.45)
... storing 'celltype_scanvi' as categorical
... storing 'C_scANVI' as categorical
/projects/ps-renlab2/kai/software/micromamba/lib/python3.9/site-packages/scanpy/plotting/_tools/scatterplots.py:392: UserWarning: No data for colormapping provided via 'c'. Parameters 'cmap' will be ignored
  cax = scatter(

Save the predicted cell type labels back to the original cell by bin matrix.
[16]:
atac = sc.read(snap.datasets.pbmc5k(type="h5ad"))
obs = data.obs
obs = obs[obs['batch'] == 'query']
obs.index = list(map(lambda x: x.split("-query")[0], obs.index))
atac.obs['cell_type'] = obs.loc[atac.obs.index]['C_scANVI']
Updating file 'atac_pbmc_5k.h5ad' from 'https://osf.io/download/y9t83/' to '/home/kaizhang/.cache/snapatac2'.
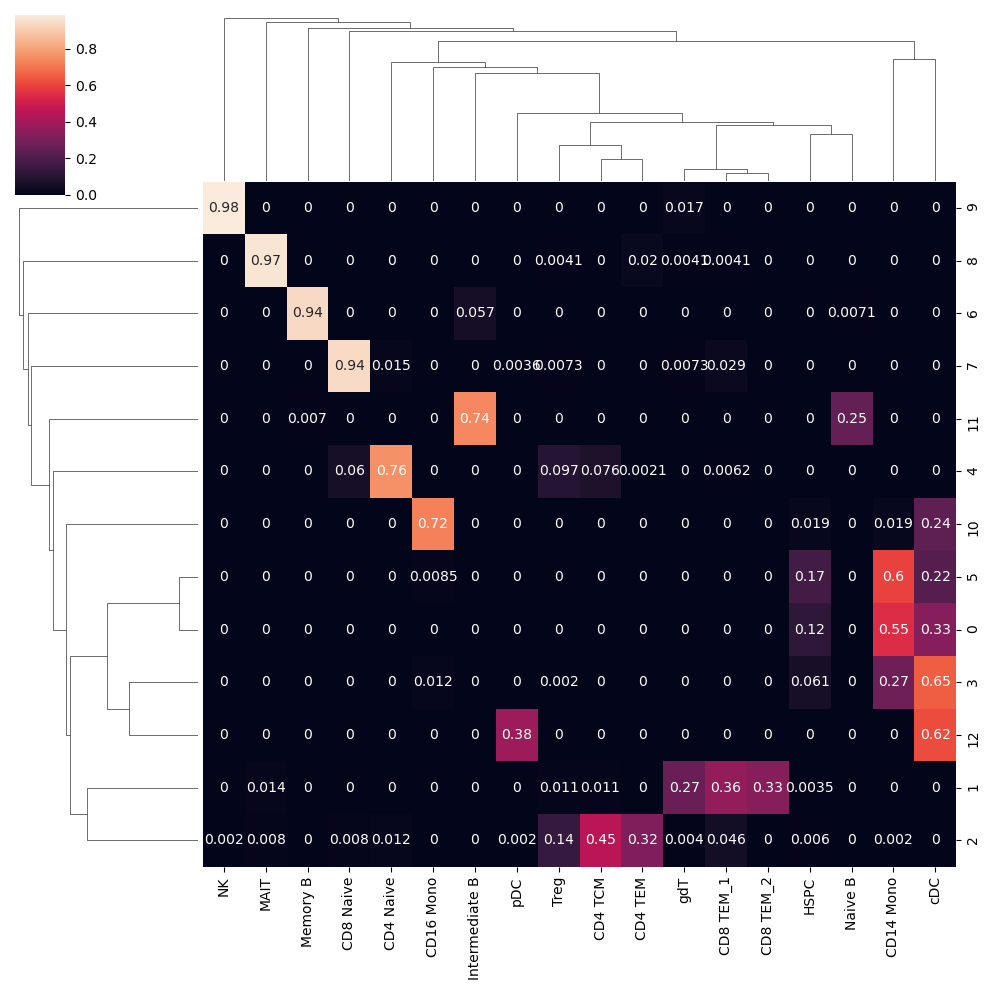
We can see that the predicted cell type labels are pretty consistent with the leiden cluster labels. Since our ATAC-seq data has fewer cells, we do not have the power to separate CD8 T and CD4 T cells, as well as a few other subtypes.
[17]:
sc.pl.umap(atac, color=['cell_type', "leiden"], wspace=0.45)

[18]:
from collections import Counter

cell_type_labels = np.unique(atac.obs['cell_type'])

count_table = {}
for cl, ct in zip(atac.obs['leiden'], atac.obs['cell_type']):
    if cl in count_table:
        count_table[cl].append(ct)
    else:
        count_table[cl] = [ct]

mat = []
for cl, counts in count_table.items():
    c = Counter(counts)
    c = np.array([c[ct] for ct in cell_type_labels])
    c = c / c.sum()
    mat.append(c)
[19]:
import seaborn as sn
import pandas as pd
import matplotlib.pyplot as plt

df_cm = pd.DataFrame(
    mat,
    index = count_table.keys(),
    columns = cell_type_labels,
)
sn.clustermap(df_cm, annot=True)
[19]:
<seaborn.matrix.ClusterGrid at 0x2b686fc2b580>

Let’s mannually refine the cell type labels at the leiden cluster level, and save the result.
[25]:
annotation = {
    "0": "CD14 Mono",
    "1": "CD8 TEM",
    "2": "CD4 TCM",
    "3": "CD14 Mono",
    "4": "CD4 Naive",
    "5": "CD14 Mono",
    "6": "Memory B",
    "7": "CD8 Naive",
    "8": "MAIT",
    "9": "NK",
    "10": "CD16 Mono",
    "11": "Naive/Intermediate B",
    "12": "DC",
}

atac.obs['cell_type'] = [annotation[i] for i in atac.obs['leiden']]
[26]:
sc.pl.umap(atac, color=['cell_type', "leiden"], wspace=0.45)
... storing 'cell_type' as categorical
/projects/ps-renlab2/kai/software/micromamba/lib/python3.9/site-packages/scanpy/plotting/_tools/scatterplots.py:392: UserWarning: No data for colormapping provided via 'c'. Parameters 'cmap' will be ignored
  cax = scatter(

[27]:
atac.write("pbmc5k_annotated.h5ad", compression="gzip")